Living In A Digital Cave
Data is not information…
Text:/ Andy Ciddor
We’re hearing a lot about ‘Big Data’ at the moment. Although having very big sets of data is hardly a new phenomenon (think weather observations and telephone books), the label is quite new and it’s being grasped firmly with both hands by the marketing people who are already growing bored with ‘The Cloud’. The reason Big Data has come to everyone’s attention recently is the exponential increase in our ability to generate and capture data of all kinds.
Big Science tools like Australia’s Synchrotron and Europe’s Large Hadron Collider, the Hubble and Japan’s Hisaki UV space telescopes and the Square Kilometre Array (SKA) radio telescope being built in Australia and South Africa, are producing data at a rate that couldn’t even be stored a few years ago, let alone be processed and analysed. But it’s not just about spectacular tools or mapping the genome of species that haven’t walked or oozed across the earth in millions of years.
Every time you click on a link on the web, read or send a text or an email, walk past a wi-fi hot spot, make a phone call, have a blood test or buy anything anywhere, the amount of data being stored just keeps on growing. Unless you need to check who woke you by calling at 7:30 last Sunday morning, or verify how much you paid for the last pair of jeans you bought, these exabytes of stored data are simply occupying valuable disk and tape space in big, secure, air-conditioned data warehouses.
Even if you’re not a three- or four-initial security agency looking for secret terrorist training camps in the Royal Botanic Gardens or tracking the covert activities of kayaking clubs, there is an immense amount of useful information that can be extracted from these data repositories and used to further our knowledge.
If you’re a telco you might want to know which customers, on which mobile data plans, access which data networks during particular sporting events. If you’re an epidemiologist you may want to know if there’s a relationship between the use of certain public transport routes and the prevalence or locality of a particular set of health issues. If you’re a physician you might want to know whether certain genes are in a given state of expression for all sufferers of a particular set of symptoms.
MOVING MOUNTAINS OF DATA
Such information doesn’t exist yet. But if researchers are given access to the various unrelated data sets that are languishing in data warehouses around the globe; have access to enough network bandwidth to bring the data into one place; and then have access to enough processing power to slice, dice and compare the data according to previously-untried recipes, new information will emerge.
However, even if you have all the storage, network capacity and processing power you need for a big data research project, there is still a major barrier to converting this new information into new knowledge: the sheer volume of the results is overwhelming. A vast spreadsheet, or a Pelican case full of hard-drives with the results of a sky survey of a couple of thousand anomalous astronomical objects may contain the clue to unravelling an unsolved-mystery, but chances are that answer may never be found in the mountain of data.
VISUALISING: HEADS UP
Despite computers being quite good at searching for relationships in vast amounts of data, the search has to be programmed by someone who knows what they’re looking for. On the other hand, many discoveries are fortuitous accidents that come about when a researcher is looking for something else entirely. Even though Skynet became self-aware at 2:14am EST on August 29th, 1997 (see the Terminator movies for full details), machine intelligence is still a long way behind the human brain when it comes to noticing unexpected relationships. As we in the AV world are well aware, the brain’s highest-bandwidth input channel, with the most direct connection, is our visual system, so it’s hardly a surprise that the best way of working with huge amounts of data is to find ways to make it visible.
Visualising data is exactly what you’re doing when you build graphs in your desktop spreadsheet software. However, when there are tens of millions of data points, with large numbers of variables with wide ranges of values that may be changing over time, the visualisation process becomes more complicated. Visualising big data sets in ways that allow the viewer to take in the scale, complexity and dynamic range of the data requires screens a little larger than your average laptop and image processing power in the range of a 20th-century supercomputer. These visualisation facilities generally have screens large enough to provide the viewer with a sense of immersion in the rendered images and increasingly use 3D images to intensify the connection between visualised data and the viewer.
Even today, with commodity data projectors, commodity flat-panel screens, multi-core CPUs in commodity laptops, and commodity graphics cards with thousands of graphic processing units, systems capable of usefully visualising Big Data, generally cost big bucks, and remain relatively rare. Such visualisation facilities are mostly found in such well-resourced places as global mining, automotive, and bio-technology companies or the military, with the few currently in public hands scattered amongst elite research institutions.
BROADENING NEW HORIZONS
Professor Paul Bonnington, director of Monash University’s e-Research Centre, describes visualisation facilities as the viewfinders for the ‘microscopes’ and ‘telescopes’ of 21st century science – the instruments that will enable advances in myriad disciplines by making visible the previously unobservable. Monash acknowledged the critical importance of visualisation tools to the future of research across the entire institution when in 2009 it allocated part of a floor of its soon-to-be built $140m New Horizons Centre for advanced teaching and research, to an advanced visualisation facility.
Although Monash recognised the importance of visualisation and was determined to be at the forefront in this area, at the commencement of the project nobody was quite sure of where that leading edge was to be found, and where it would be by the time the facility was open for business in 2013. A group from Monash and the New Horizons design team undertook a five-day study tour of leading visualisation facilities in the USA to determine the direction of developments in visualisation and to begin the process of selecting the tool for Monash. That group included Sean Wooster, Principal ICT Consultant at Umow Lai, which provided engineering consultancy on the infrastructure for the New Horizons project. As a result of the tour, the New Horizons visualisation facility was allocated a 10m x 10m space with a 10m ceiling height. Wooster knew that it would need a lot of power, data connectivity and HVAC, but even as construction got underway that was all he knew. As the facilities the study tour had examined used rear projection systems and loudspeakers, rigged above and behind the walls of the visualisation space, a 1.5m-wide gantry was constructed around the room at a height of 6m to allow for rigging, maintenance and service access to projectors.
“”
Data is not information, information is not knowledge, knowledge is not understanding, understanding is
not wisdom.
– usually attributed to
Clifford Stoll & Gary Schubert
DIGGING A CAVE
In early 2013 a CAVE2 (Computer Automated Virtual Environment version 2) system was selected for the New Horizons building. Developed by the Electronic Visualisation Laboratory (EVL) at the University of Illinois at Chicago, to replace their existing CAVE system, the technology of CAVE2 has been licensed for commercial development to Mechdyne, a US company specialising in visualisation systems for a wide variety of applications. Although the CAVE2 for Monash was purchased ‘off-the-peg’ from Mechdyne, it is in fact the first such system other than the prototype at EVL and is a more powerful and much further refined development of the concept.
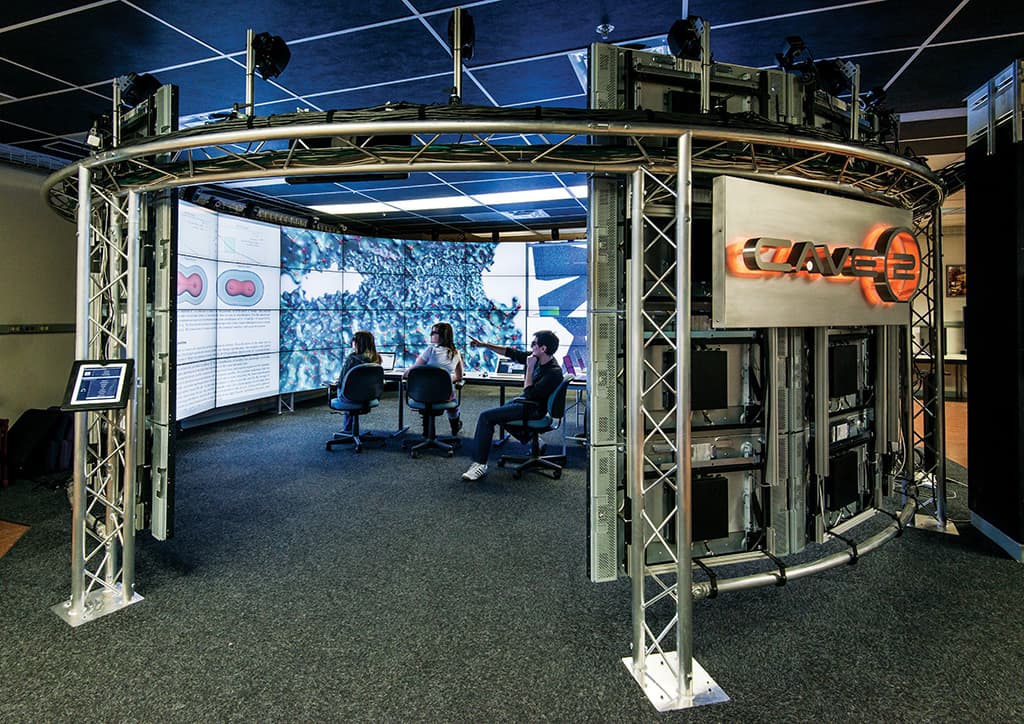
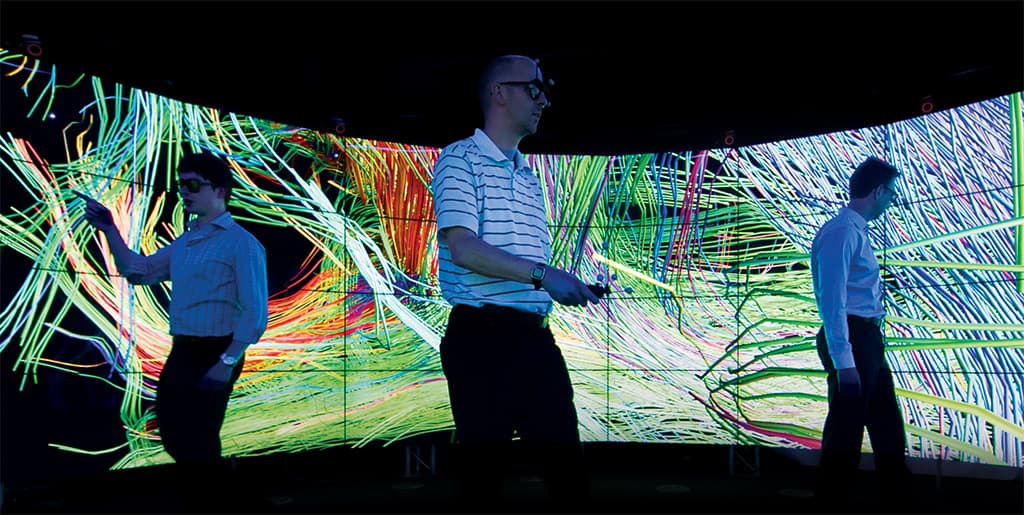
Display technology has moved on so far since 2009 that CAVE2 doesn’t even use projectors, much less in complex custom configurations. Indeed, most of its components are essentially commercial-off-the-shelf. It’s a 7.3m-diameter by 2.4m-high cylindrical array of truss-mounted flat-panel displays, giving a 330° field of view. The access catwalk is now only used as a viewing platform to allow guided tours of the facility to get a good view of the visualisation space without disturbing arrangements on the floor.
The truss cylinder carries 20 columns, each of four Planar Matrix LX46L 3D (46-inch diagonal) LCD panels. These micropolarizer-equipped 3D panels have a resolution of 1366 x 768 pixels, which amounts to full retinal acuity for the majority of the 3D viewing space. Total system display resolution is 27320 x 3072 pixels. To avoid visual cross-talk between the polarizing bands on the top and bottom rows of monitors, their micropolarizer arrays are offset by 9° in the appropriate direction to retain optimum 3D imaging. The use of passive, polarized 3D not only allows the use of inexpensive polarized viewing glasses for 3D work, it also eliminates the issue of synching 80 active monitors for viewers moving around in the visualisation space.
The images for each column of four panels are rendered by a Dell Precision R7610 computer fitted with dual eight-core Xeon CPUs, 192GB of RAM, a pair of 10GBps network interfaces and a pair of 2.1 Teraflop NVIDIA Quadro K5000 video cards, each with 1536 CUDA parallel processor cores. Each column of panels is driven by an external Planar power supply module and Planar quad video wall controller module, mounted adjacent to the rendering computer. The 20-machine cluster driving the CAVE2 would have ranked right up there in Australia’s supercomputer stakes just a decade ago.
TAKING THE HEAT
The entire visualisation facility is built on a modular raised-floor system to enable the complex cabling to be installed, maintained and endlessly reconfigured. While the flooring system also provides for quiet, low-speed chilled air to be circulated into the space, it simply isn’t enough to handle the 20kW of heat produced by the 80 display panels in the viewing space and the 15kW output from the fully-loaded racks in the adjacent machine room. Sean Wooster from Umow Lai revealed that in the end, the capacity of the building’s air-conditioning and power delivery infrastructure became an important factor in the selection of the visualisation system. Although the planners had expected that flat panel displays would eventually replace projectors in visualisation systems, the leap to systems on the scale of the CAVE2 installation is far beyond anything that had been envisaged.
MOTION TRACKING
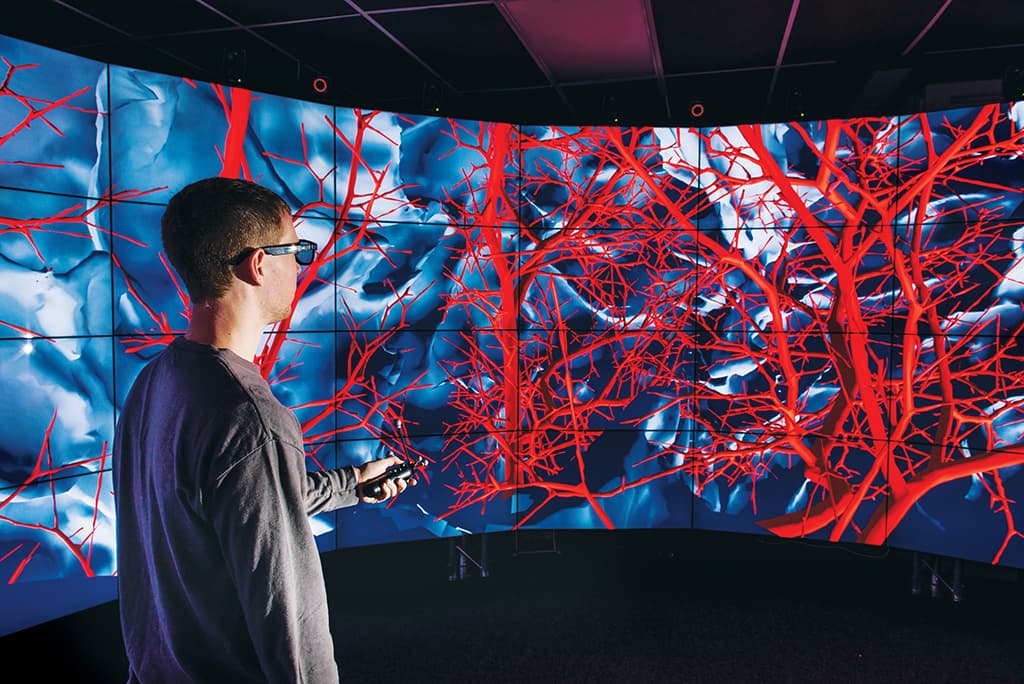
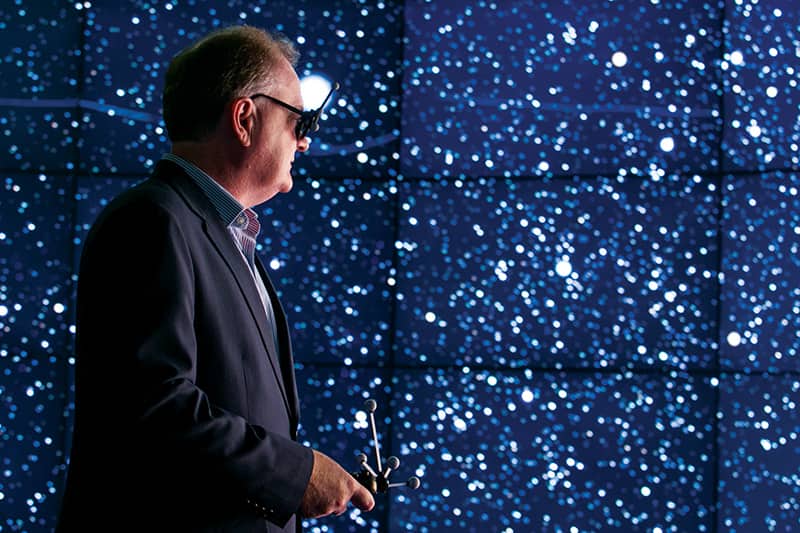
Interaction between the viewer and the rendering system is primarily via an optical motion tracking network of 14 Vicon Bonita infrared cameras, mounted around the top of the support truss. The cameras track the location of retroreflective markers on the head of the primary viewer and attached to the handheld navigation controller in six degrees of freedom, and return results to the rendering system’s input management computer using Virtual-Reality Peripheral Network protocol. The handheld navigator wand also incorporates orientation-aware wireless remote functions for input selection and control.
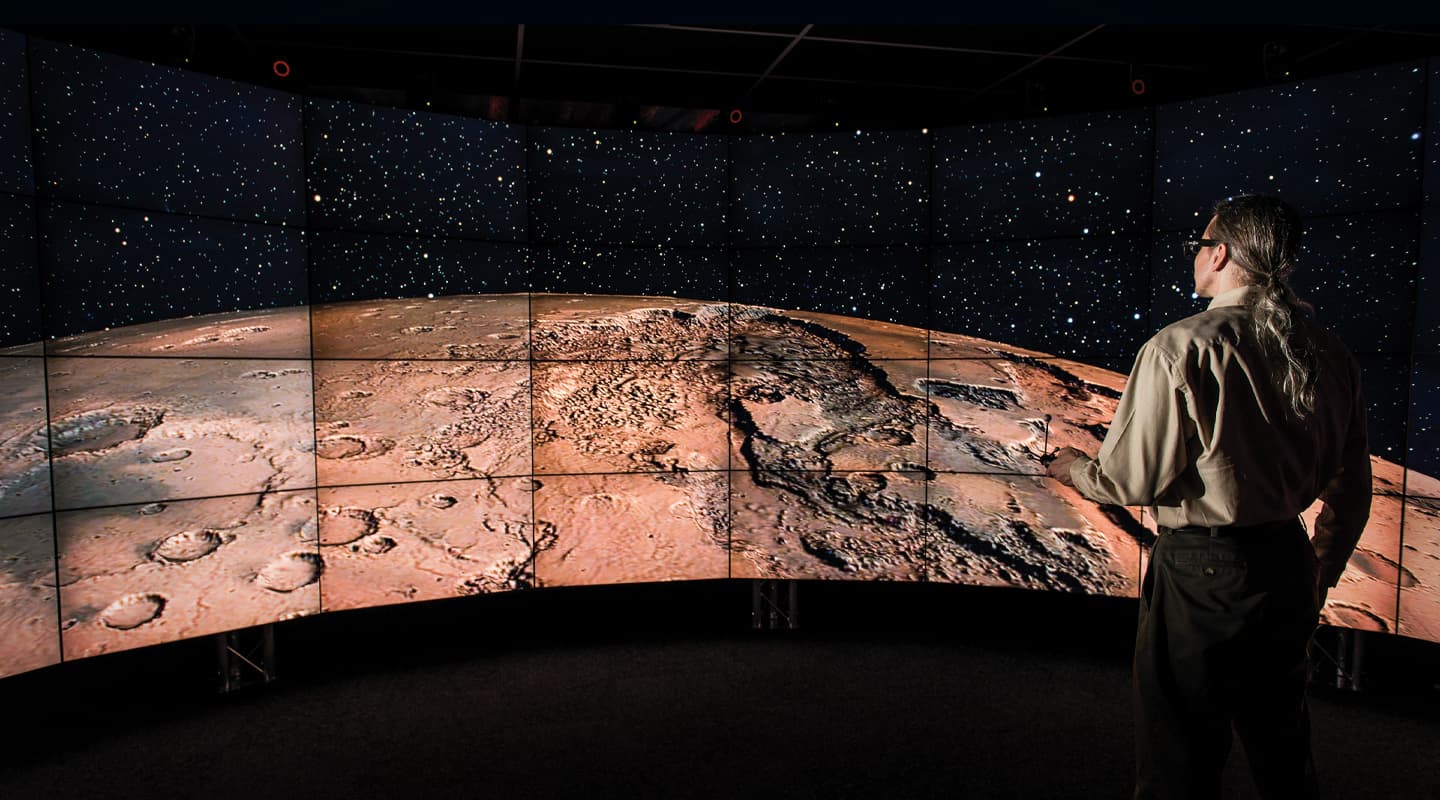
Donning the primary viewer’s glasses with their little white-tipped tracker antennae and walking through a rendered environment, or having the whole screen system tracking your head movements, is an experience that’s better than any dark ride. As someone with an abiding interest in space science who’s closely followed the journeys of the three Mars rovers, I was captivated to be able to stand in a fully-immersive 3D Martian landscape composited from thousands of the 1024 x 1024-pixel stereo images taken by the Opportunity rover.
While principally a visualisation facility, the CAVE2 is also well equipped to provide immersive and accurately-imaged surround sound through a 22.2-channel 24-bit system driven by a dedicated audio-processing computer. The speakers for this system consist of 22 compact, nearfield Genelec 6010A bi-amped (12W+12W) full-range cabinets mounted around the top of the truss ring, while sub-bass comes from a pair of floor-mounted Genelec 7050B active (70W) subwoofers. Signal distribution is via MADI. A THX-certified 7.2 channel receiver is also present to decode and process output from movie material.
SAGE ADVICE
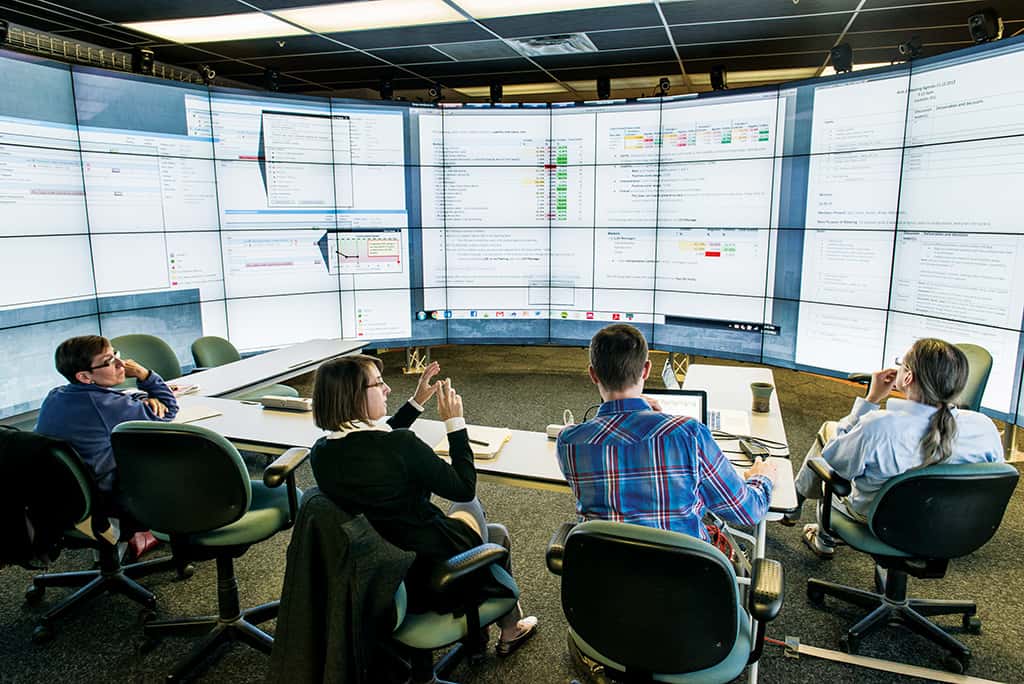
One of the five operating environments currently being used for the CAVE2 environment is SAGE (Scalable Adaptive Graphics Environment) which can launch, display and manage the layout of multiple visualizations in disparate formats on a single tiled-display system. In Fully Immersive mode, the entire system displays a single simulation. In 2D mode, the system can operate like a standard display wall, enabling users to simultaneously work with large numbers of flat images and documents. In Hybrid mode, some of the objects displayed can be immersive 3D windows with each able to be controlled by independent 3D user interface devices. Hybrid mode is one of the unique and compelling features of the CAVE2 environment.
Perhaps the most complex part of operating a big data visualisation facility is getting that data onto the screens in ways that give researchers insights into the relationships embedded in their data. To achieve this requires researchers to either learn how, or have access to skilled programmers who know how, to take the appropriate elements of the dataset, then scale, manipulate and translate it into a visualiser control language to visually present those previously unseen relationships. Right now Monash is in the process of developing those skills within its user community.
CAVE2 is a very impressive piece of kit with application possibilities that are limited more by the user’s imagination and the demands for its use, than by any capability it lacks.
MORE INFORMATION
CAVE2 at Monash: monash.edu/cave2/
Mechdyne: www.mechdyne.com
EVL at UIC: www.evl.uic.edu
Umow Lai: www.umowlai.com.au









RESPONSES